
WTI Crude Oil Futures Backwardation Across Major Wars [TEST DRAFT POST]
A systematic review of WTI crude oil futures backwardation behavior across seven major wars and conflicts from 1973 to 2026, revealing internal regularities such as convenience yield spikes and the three-phase price model.
1. Introduction and Core Concepts
1.1 Research Background
The term structure of the crude oil futures market is a central window into the supply-demand dynamics of the global energy market. When the front-month contract price is higher than deferred contracts, the market is in Backwardation; conversely, it is in Contango.
War and geopolitical conflicts are among the most powerful catalysts that push the crude oil market into backwardation. The supply-disruption panic triggered by conflict drives market participants to compete for near-term physical barrels, pushing spot and front-month futures to a premium over the deferred curve.
This report systematically reviews the backwardation behavior of WTI CME contracts across seven major wars and conflicts between 1973 and 2026, revealing the underlying regularities and driving mechanisms.
1.2 Core Terminology
| Term | English | Definition |
|---|---|---|
| 逆价差 | Backwardation | Front-month futures price > deferred futures price |
| 顺价差 | Contango | Front-month futures price < deferred futures price |
| Prompt Spread | M1-M2 Spread | The spread between the front-month and the second-month contract |
| 便利收益率 | Convenience Yield | The implicit benefit of holding the physical commodity rather than a futures contract |
| 战争溢价 | War Premium | The additional geopolitical risk premium embedded in price during a conflict |
2. Theoretical Framework: Theory of Storage and Convenience Yield
2.1 Theory of Storage
The relationship between futures and spot prices is described by the Theory of Storage:
Where:
- F = Futures Price
- S = Spot Price
- C = Cost of Carry, including storage, insurance, and financing costs
- Y = Convenience Yield, the implicit benefit of holding the physical commodity
When Y > C, the futures price falls below the spot price and the market enters backwardation.
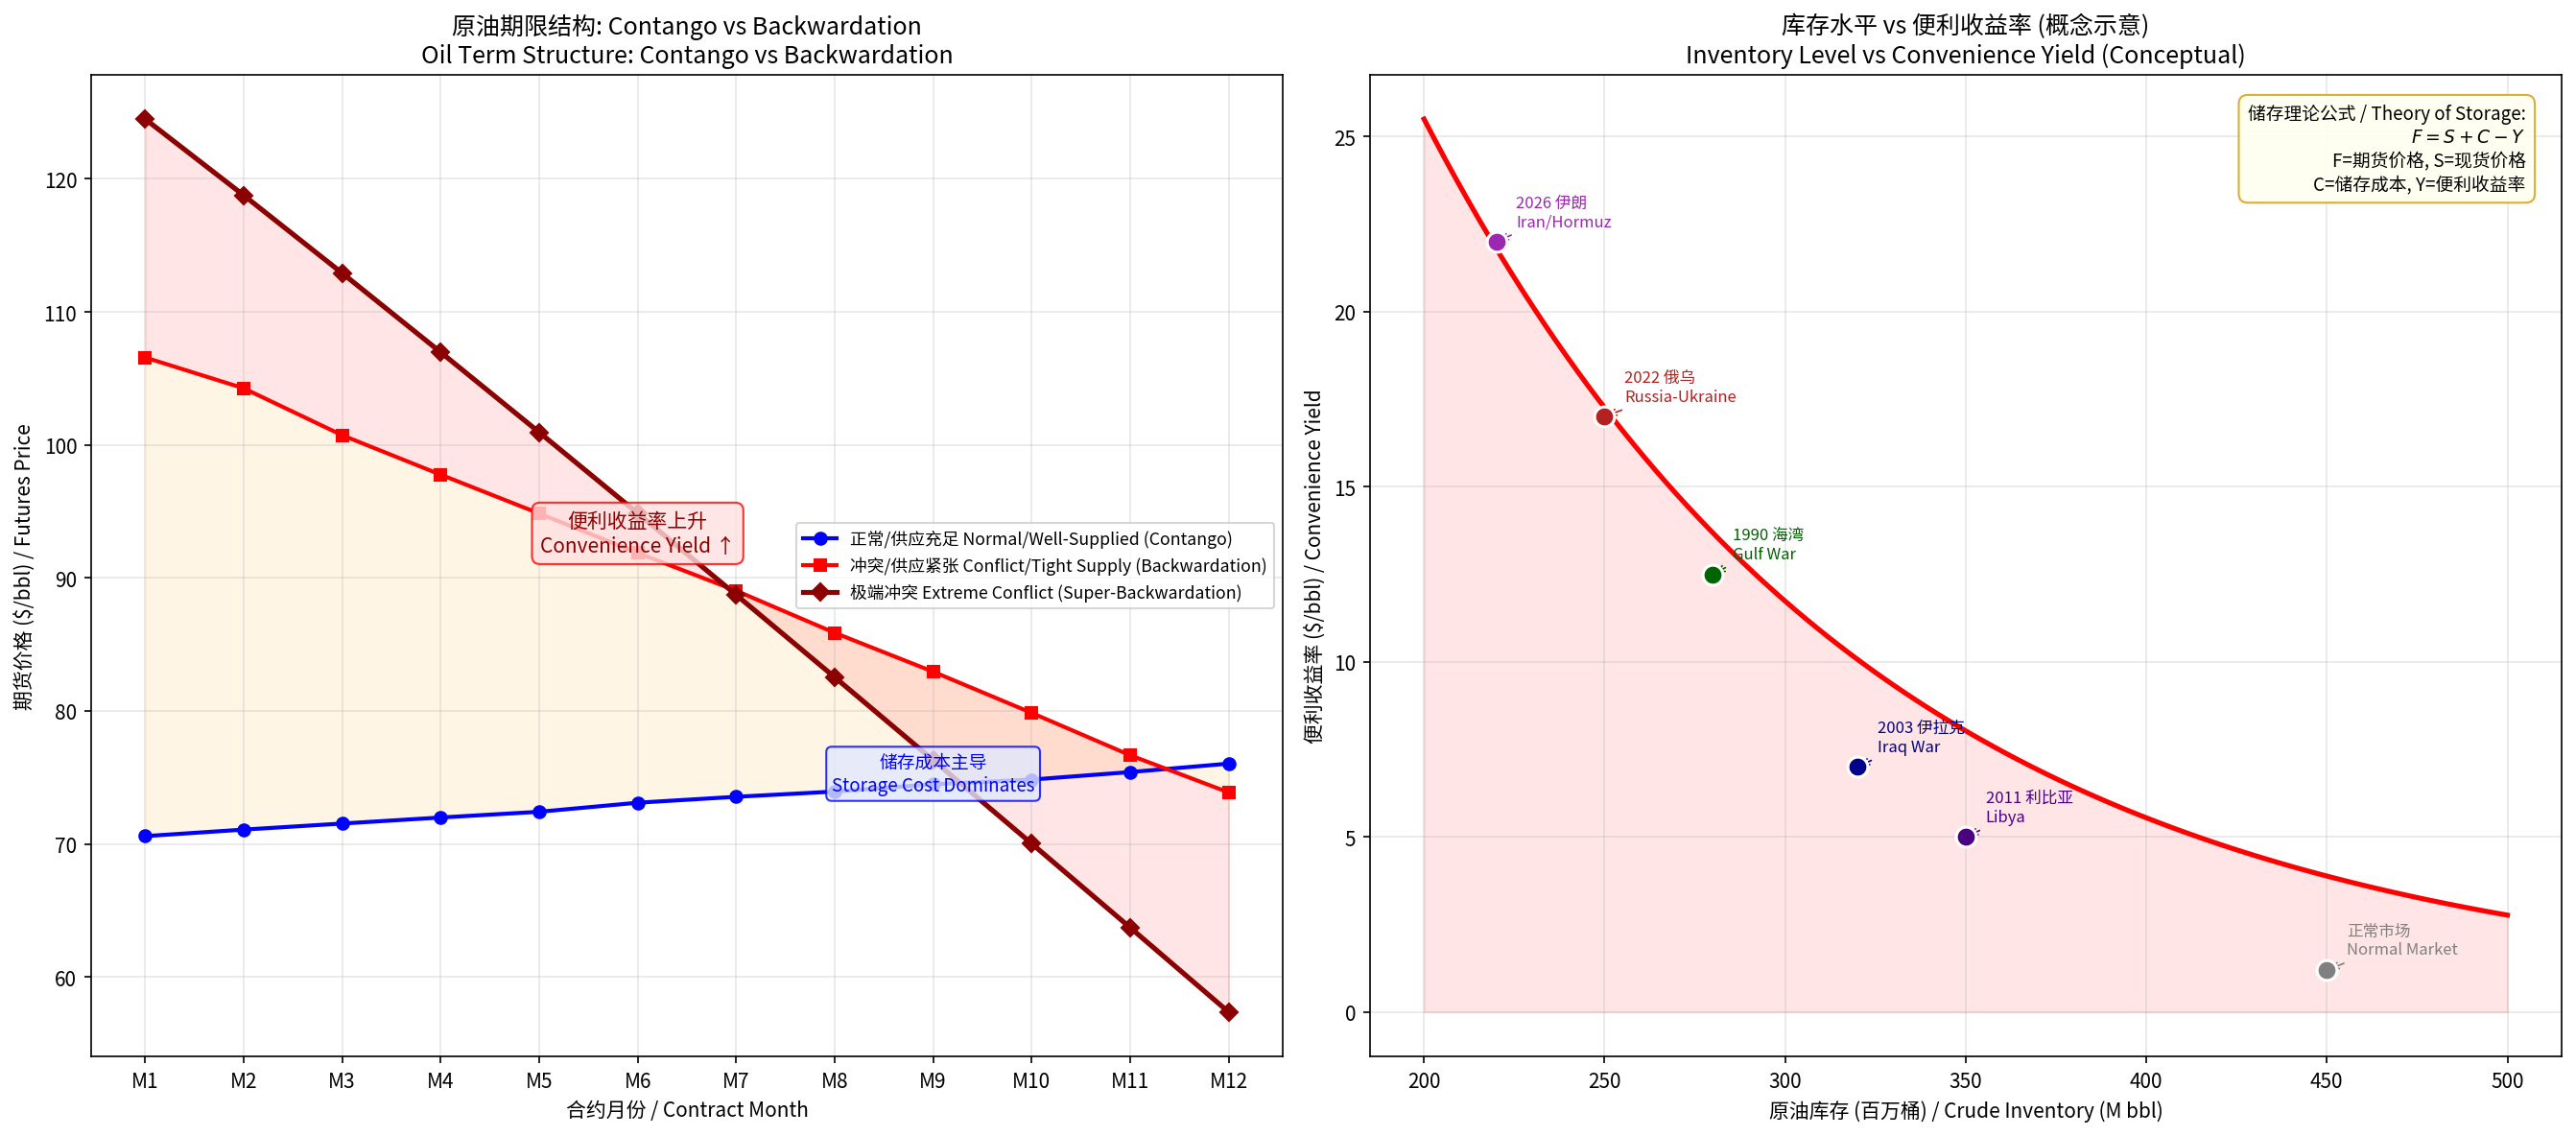
2.2 How War Drives Backwardation
War and conflict push the crude oil market into backwardation through the following mechanisms:
Key Mechanisms:
- Supply-panic effect: Actual or expected supply losses driven by conflict force refiners and traders to scramble to lock in near-term delivery contracts.
- Convenience yield spike: In a physical-shortage environment, the value of holding crude (avoiding shutdowns at refineries and production sites) far exceeds storage costs.
- Inventory-drawdown spiral: Backwardation itself discourages inventory hoarding (storage becomes a loss-making activity), further tightening near-term supply.
- Asymmetry of uncertainty: Near-term risk is highly concentrated, while the deferred market expects the conflict to be eventually resolved — producing a curve that is steep at the front and flat at the back.
3. Backwardation Analysis Across Past Conflicts
Overview
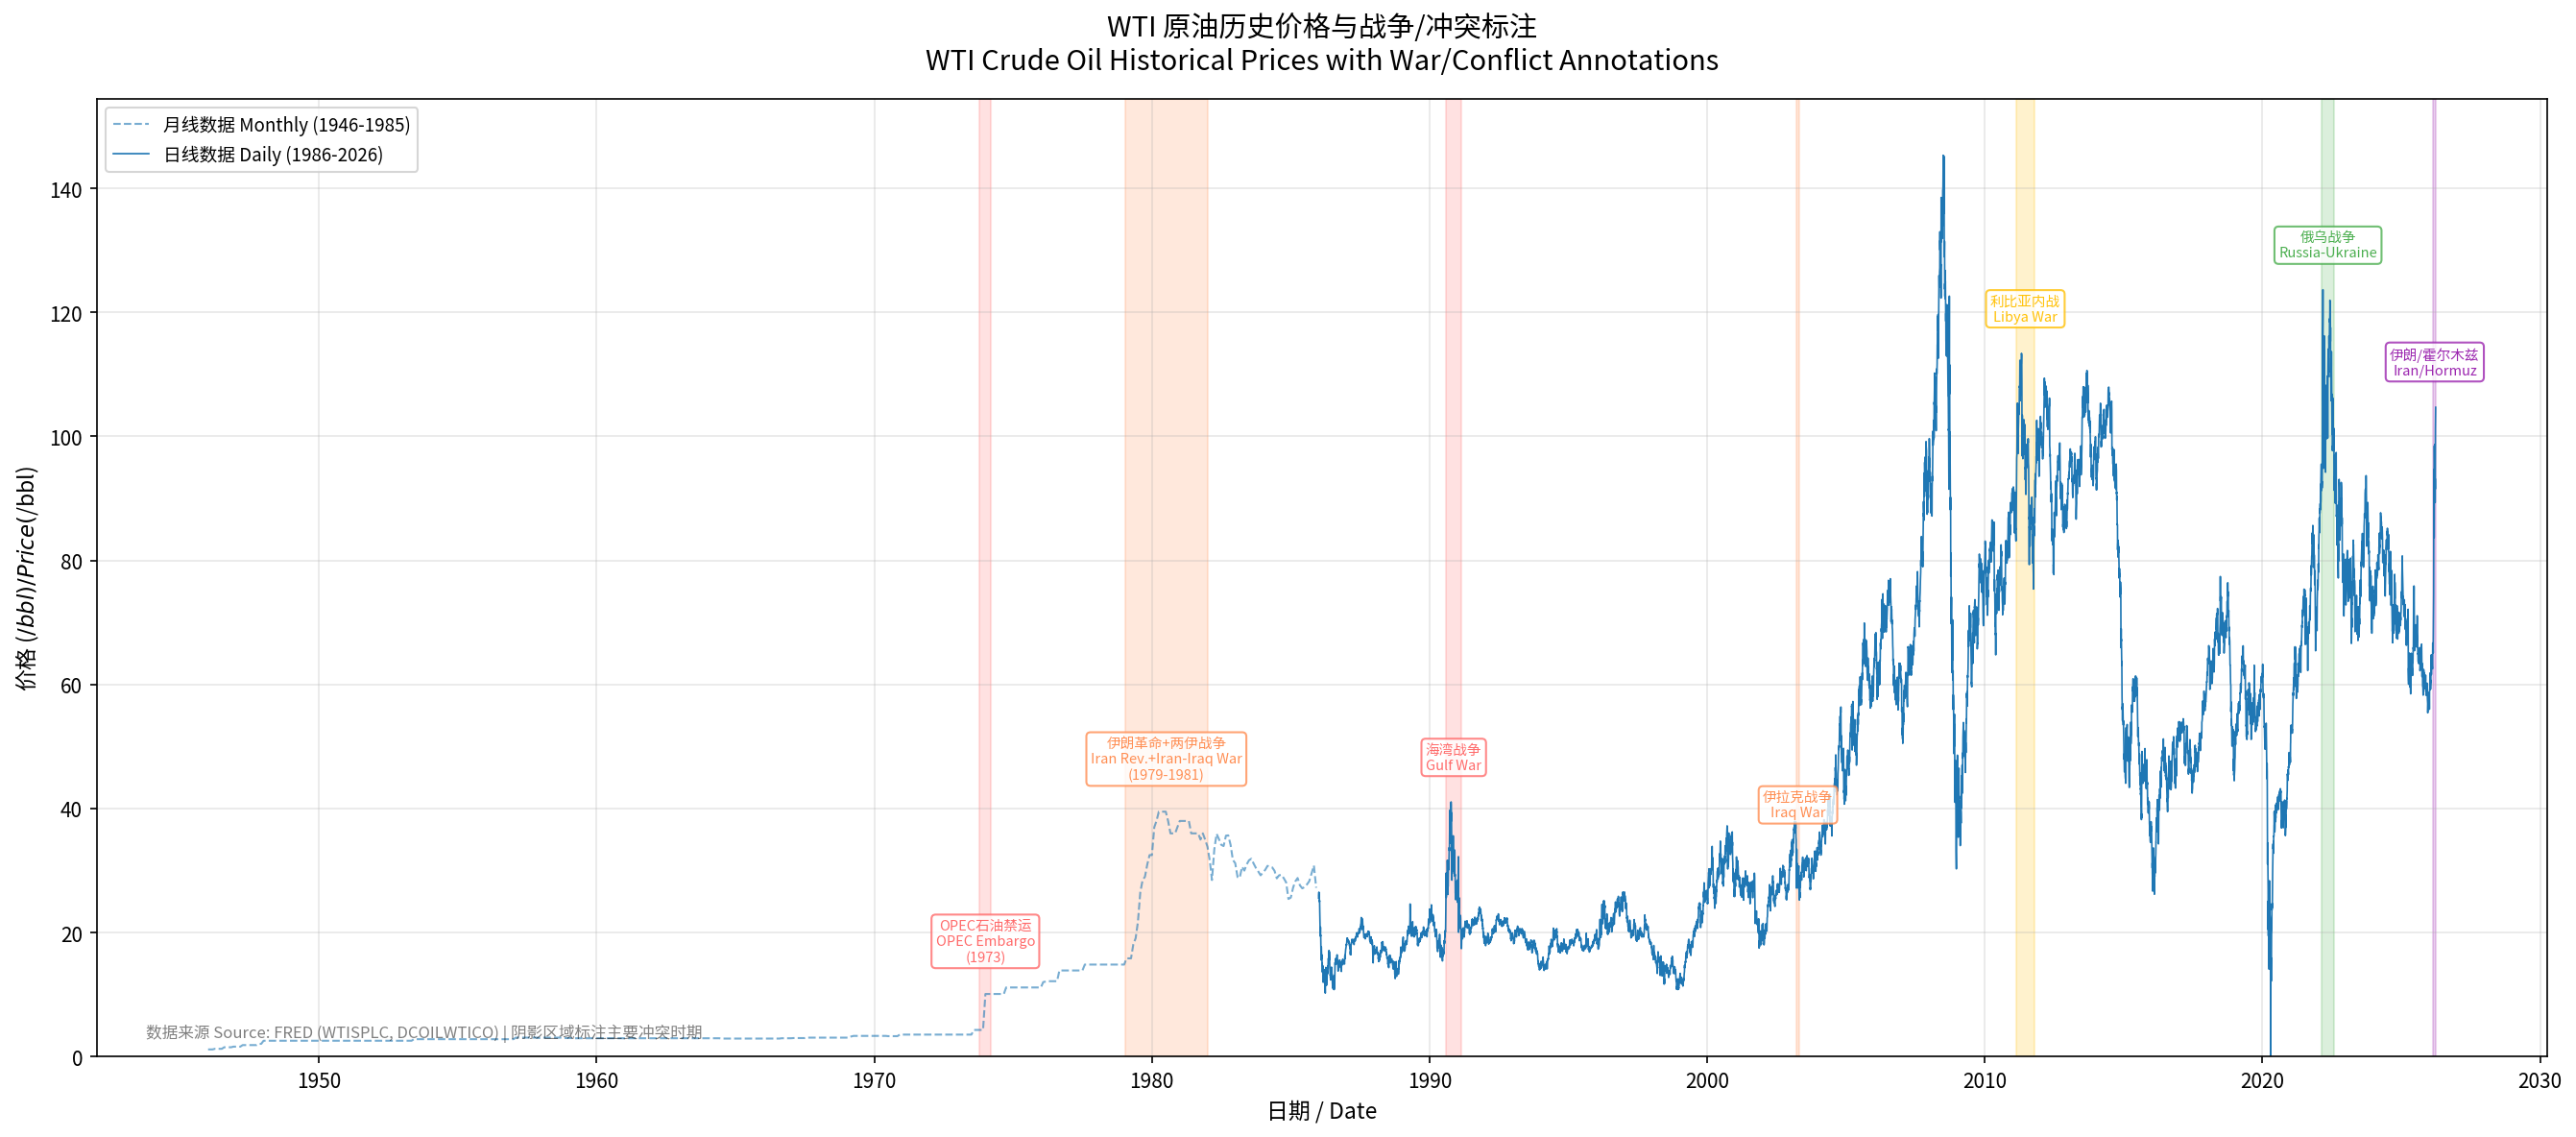
The chart above shows the full WTI price trajectory since 1946, with the time windows of seven major wars and conflicts annotated. Each conflict corresponds to a significant price spike and a dramatic shift in the term structure.
3.1 OPEC Oil Embargo (October 1973 — March 1974)
Background: The Yom Kippur War broke out on October 6, 1973. OAPEC (Organization of Arab Petroleum Exporting Countries) announced an oil embargo against countries supporting Israel and simultaneously cut production.
| Indicator | Data |
|---|---|
| Pre-conflict oil price | ~$3/bbl |
| Peak oil price | ~$12/bbl |
| Increase | +300% |
| Supply loss | 4.4M bpd |
| Embargo duration | 6 months |
| Futures market | Did not yet exist (NYMEX WTI futures only launched in 1983) |
Backwardation Analysis:
Although no formal crude oil futures market existed in 1973, the extreme tightness of the spot market essentially reflected the physical reality of a "super-backwardation":
- Spot prices surged 400% within six months, far exceeding any expectation embedded in forward delivery prices
- A severe shortage of physical crude emerged; gas station queues and rationing systems were widely implemented in the United States and Europe
- Oil companies purchasing through term contracts paid far less than the spot market; this spread itself reflected an extremely high convenience yield
- Market participants were willing to pay almost any premium for immediate delivery
Key Lesson: This crisis directly created the demand for standardized futures contracts. NYMEX eventually launched WTI crude oil futures in 1983, precisely to provide tools for price discovery and risk management.
3.2 Iranian Revolution and Iran–Iraq War (January 1979 — 1981)
Background: The 1979 Iranian Revolution overthrew the Pahlavi dynasty, and Iranian oil exports plunged from 6 million barrels per day to 1.5 million. In September 1980, Iraq invaded Iran, further deteriorating the supply situation.
| Indicator | Data |
|---|---|
| Pre-conflict oil price | ~$14/bbl |
| Peak oil price | ~$37/bbl (1981 annual average) |
| Increase | +164% |
| Supply loss | 5.6M bpd |
| Global production decline | 7% |
| Futures market | Embryonic stage (active spot market) |
Backwardation Analysis:
- This was one of the largest single supply shocks in history (the 5.6M bpd loss is second only to the 2026 Strait of Hormuz crisis)
- Spot prices surged above forward contract prices, reflecting an extremely high convenience yield
- Unlike 1973, an active Rotterdam spot market had emerged, making price discovery more dynamic
- Prices remained elevated for a sustained 18 months — the longest duration of conflict-driven backwardation on record
- The high-price era was eventually ended by demand-side adjustments (energy-saving measures in OECD countries) and the growth of non-OPEC supply (North Sea, Alaska)
3.3 Gulf War (August 1990 — February 1991)
Background: On August 2, 1990, Iraq invaded Kuwait, removing 4.3 million barrels per day of production capacity from the global market in a single stroke.
| Indicator | Data |
|---|---|
| Pre-conflict oil price | ~$21/bbl |
| Peak oil price | $41.07/bbl (October 1990) |
| Increase | +95.2% |
| Supply loss | 4.3M bpd |
| Peak M1-M2 prompt spread | ~$3.5/bbl |
| Peak front-month vs December deferred spread | ~$8/bbl |
| Backwardation duration | ~5 months |
Detailed Backwardation Analysis:
The Gulf War was the first major war shock experienced by the NYMEX WTI futures market (after its launch in 1983), providing the first clear case of how the futures term structure reacts to war.
Phase 1 — Invasion Shock (August 1990):
- After Iraq invaded Kuwait, WTI spot prices surged from ~$21 to $28, a 33% increase in just one week
- The term structure flipped sharply from mild contango to sharp backwardation
- The front-month premium reflected panic buying of physical crude by refiners
Phase 2 — Sustained War Premium (September–October 1990):
- Prices continued climbing to a peak of $41.07 on October 11
- The market maintained an M1-M2 prompt spread of about $3.5/bbl
- The front-month contract traded at approximately $8/bbl over the 13-month deferred contract
- Production increases from other OPEC members (Saudi Arabia raised output from 5.4M to 8M bpd) partially eased the depth of backwardation
Phase 3 — Operation Desert Storm Collapse (January 17, 1991):
- On the day the coalition launched its air campaign, WTI plunged by $10.56/bbl — the largest single-day decline on record at that time
- Backwardation disappeared almost immediately and the term structure rapidly reverted to contango
- The market followed the classic "Buy the Rumor, Sell the Fact" pattern
Key Finding: The Gulf War established the classic three-phase model of wartime crude oil backwardation: Shock → Sustain → Collapse upon resolution.
3.4 Iraq War (2002 — 2003)
Background: The United States invaded Iraq on March 20, 2003. Prior to that, the Venezuelan general strike (December 2002 – February 2003) had already tightened global crude supply.
| Indicator | Data |
|---|---|
| Pre-conflict oil price | ~$26/bbl |
| Peak oil price | ~$40/bbl (February 2003) |
| Increase | +53.8% |
| Supply loss | 2.3M bpd (Iraq + Venezuela) |
| Peak M1-M2 prompt spread | ~$2.8/bbl |
| Peak front-month vs 13-month deferred spread | >$8/bbl |
| Backwardation duration | ~8 months |
Detailed Backwardation Analysis:
The Iraq War illustrates a pattern of gradual backwardation buildup, in contrast to the "sudden flip" of the Gulf War.
Term Structure Evolution Timeline:
- Early 2002: WTI was in contango (ample market supply)
- February 2002: As U.S. military rhetoric on Iraq escalated, WTI shifted from contango to backwardation
- December 2002: With the Venezuelan strike overlapping war expectations on Iraq, backwardation deepened sharply
- February 2003: Backwardation peaked — the front-month contract traded at more than $8/bbl over the 13-month deferred contract, with the war premium estimated at $5–15/bbl
- March 20, 2003: On the day U.S. forces invaded Iraq, oil prices began falling immediately — replaying the "Gulf War syndrome"
Key Differences:
- The buildup period of this backwardation was longer (about 13 months), because the war escalated gradually rather than erupting suddenly
- The dual supply shock (Venezuela + Iraq) made the backwardation more persistent than a single-conflict event
- The decay of the war premium was slower than in the Gulf War, because Iraqi production recovered slowly during postwar reconstruction
3.5 Libyan Civil War (February 2011 — October 2011)
Background: The Arab Spring spread to Libya, and the Gaddafi regime faced armed opposition. Libyan oil production plummeted from 1.6 million barrels per day to near zero.
| Indicator | Data |
|---|---|
| Pre-conflict oil price | ~$85/bbl |
| Peak oil price | $113.39/bbl (April 2011) |
| Increase | +34.1% |
| Supply loss | 1.6M bpd |
| Peak M1-M2 prompt spread | ~$2.2/bbl |
| Peak front-month vs December deferred spread | ~$6.5/bbl |
| Backwardation duration | ~7 months |
Detailed Backwardation Analysis:
The Libyan crisis showcased a special pattern of "quality-driven" backwardation:
WTI vs Brent Divergence:
- Libya produced light sweet crude (similar to Brent grade), and the collapse of its output directly hit feedstock supply for European refiners
- Brent's backwardation was more severe than WTI's, because Libyan crude was a direct substitute for the Brent blend
- The Brent–WTI spread widened dramatically during this period to over $25/bbl (compared with the normal level of about $2–3/bbl)
- WTI was constrained by abundant Cushing inventories (the early days of the U.S. shale boom), which suppressed the depth of its backwardation
Unique Characteristics:
- This is a textbook case in which the depth of backwardation is strongly correlated with the quality of the supply being disrupted
- The reversion of prices and the term structure tracked the progress of opposition forces in regaining control of oilfield infrastructure
- On August 22, 2011, after the opposition entered Tripoli, Brent fell by more than $3/bbl in a single day
3.6 Russia–Ukraine War (February 2022 — Second Half of 2022)
Background: On February 24, 2022, Russia launched a full-scale invasion of Ukraine. Western sanctions of unprecedented scope, combined with buyers' "self-sanctioning" of Russian crude, drove the supply shock.
| Indicator | Data |
|---|---|
| Pre-conflict oil price | ~$76/bbl |
| Peak oil price | $130.50/bbl (March 8, 2022) |
| Increase | +71.1% |
| Supply loss | ~3.0M bpd (sanctions + self-sanctioning) |
| Peak M1-M2 prompt spread | $5.6/bbl |
| Peak front-month vs 5-year deferred spread | ~$60/bbl |
| Backwardation duration | ~10 months |
Detailed Backwardation Analysis:
The Russia–Ukraine War produced WTI's historical "Super-Backwardation", with multiple indicators setting records:
Unprecedented Metrics:
- On March 8, 2022, the front-month WTI contract's premium over the 5-year deferred contract reached nearly $60/bbl — the largest absolute level on record
- The M1-M2 prompt spread surged to $5.6/bbl — never exceeding $4 in any prior conflict
- Brent's M1-M2 spread also set a record high
Why Was the Backwardation So Extreme?:
- Low inventory baseline: The market entered the conflict already in a low-inventory state (post-COVID demand rebound + OPEC+'s conservative production increases), with little buffer
- Substitution difficulty: Russia is the world's third-largest oil producer (~10M bpd), and its crude grades (such as Urals) are difficult to substitute quickly in the European refinery slate
- Sanctions uncertainty: As the scope of sanctions kept expanding, buyers could not predict which transactions would remain compliant, leading to "self-sanctioning" beyond the actual ban
- Limited SPR releases: Although the U.S. released a record 180 million barrels from its Strategic Petroleum Reserve, this only slowed rather than reversed the backwardation
Decay Characteristics:
- Unlike the Gulf War / Iraq War pattern of "collapse upon conflict resolution," the Russia–Ukraine War's backwardation decayed slowly (lasting about 10 months)
- The reason is that sanctions are ongoing rather than a one-off event; the market needed time to build new trade routes (such as Russian crude shifting to India / China)
3.7 Iran War / Strait of Hormuz Crisis (February 2026 – Present)
Background: On February 28, 2026, the United States and Israel launched air strikes against Iran. On March 1, the Iranian Revolutionary Guard announced the closure of the Strait of Hormuz — the chokepoint through which roughly 20% of global oil and 59% of global LNG exports must pass.
| Indicator | Data |
|---|---|
| Pre-conflict oil price | ~$67/bbl |
| Peak oil price | ~$120/bbl (intraday), $111.42 (close, April 2) |
| Increase | +79.1% |
| Supply loss | 8.0M bpd (largest on record) |
| Peak M1-M2 prompt spread | $16.70/bbl (April 2, all-time record) |
| Peak front-month vs December deferred spread | ~$40/bbl |
| Backwardation status | Still ongoing (as of April 6, 2026) |
Detailed Backwardation Analysis:
This is the most extreme backwardation event in the history of the crude oil market, with multiple indicators surpassing the 2022 Russia–Ukraine War records by multiples.
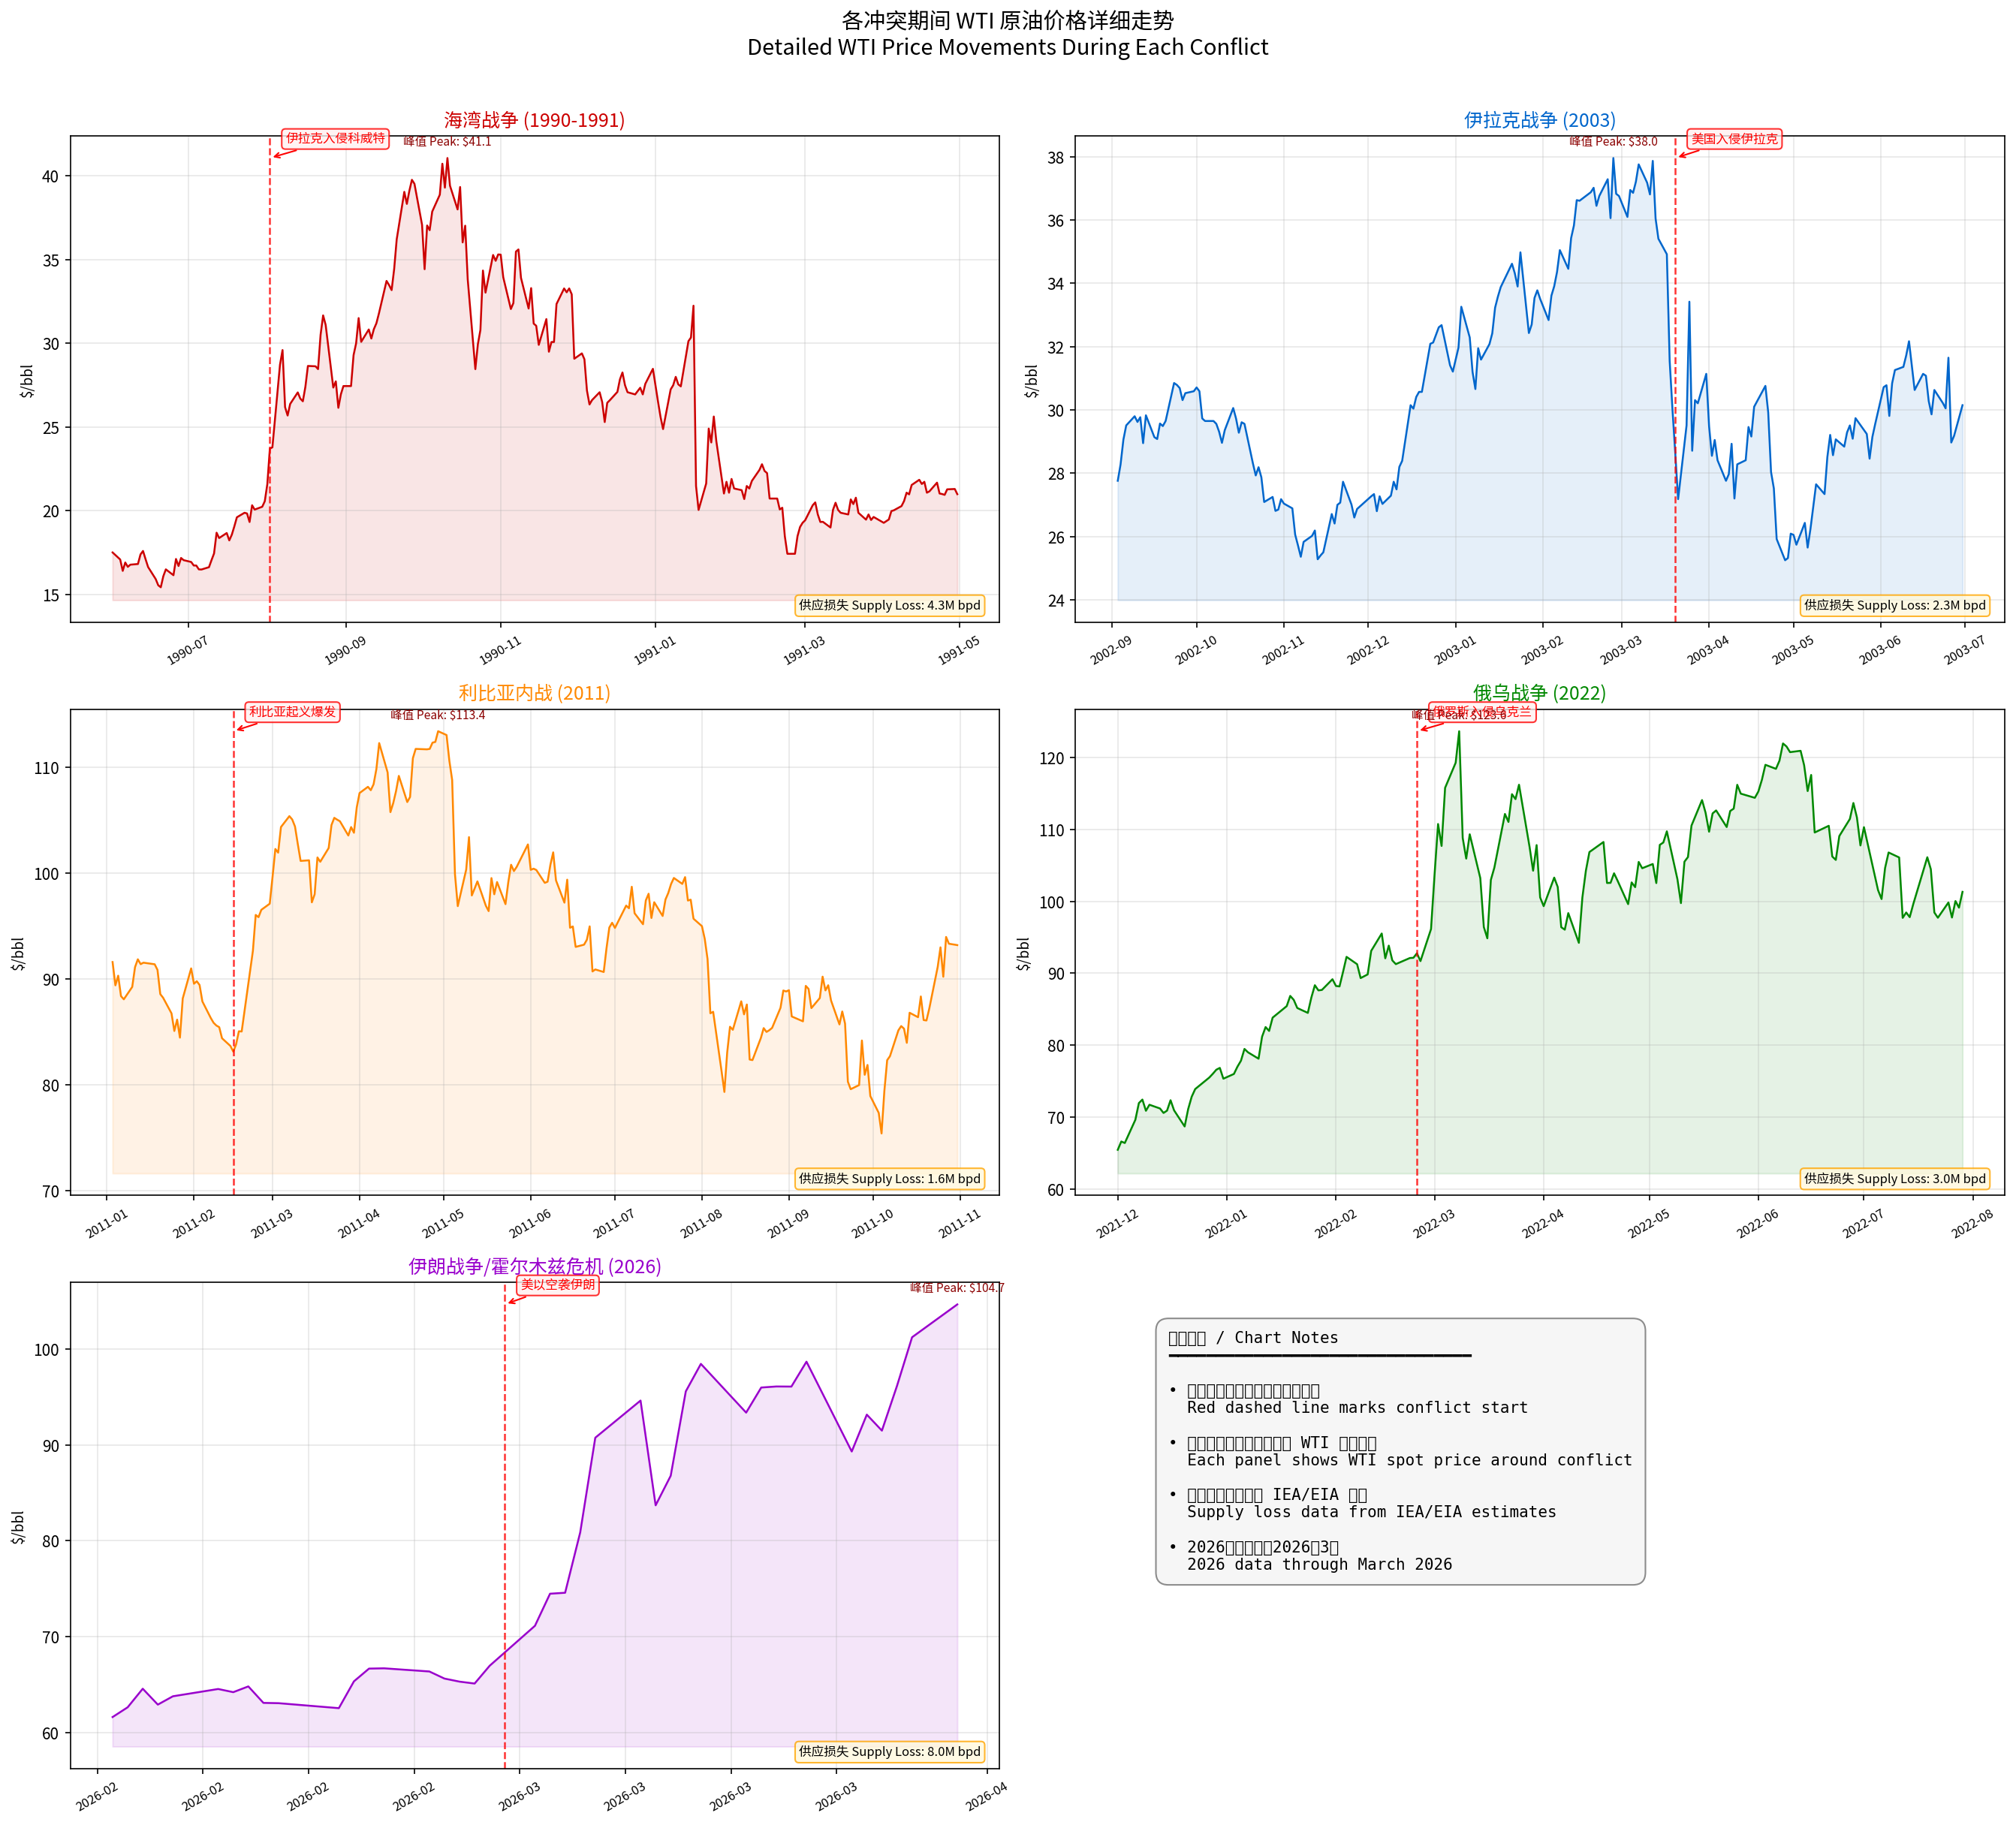
Record-Setting Term Structure:
- M1-M2 spread of $16.70/bbl (April 2) — 3 times the peak of the 2022 Russia–Ukraine War ($5.6)
- 1-month vs 1-year spread of about $40/bbl
- The December 2028 contract is roughly $33/bbl below the front month
- The far end of the curve (mid-2030s) remains near $50/bbl, indicating that the market views this as a temporary shock rather than a permanent structural change
Crisis Timeline:
| Date | Event | WTI Price |
|---|---|---|
| February 27 | Last trading day before the conflict | $67.02 |
| February 28 | U.S.–Israeli air strikes on Iran | Gapped up to ~$85 |
| March 1 | Iran closes the Strait of Hormuz | ~$90 |
| March 4 | Gulf producers forced to cut output (storage full) | ~$95 |
| March 11 | IEA releases 400 million barrels of strategic reserves | Brief pullback |
| March 18 | Iran attacks Qatar's Ras Laffan LNG facility | Spike again |
| April 2 | M1-M2 spread sets record at $16.70 | $111.42 |
| April 5 | Trump threatens Iran "open the strait by next Tuesday or face hell" | Continued rise |
Why Has the Backwardation Reached Unprecedented Depth?:
- Unprecedented scale of supply disruption: An 8M bpd loss far exceeds any historical conflict (Iran–Iraq War 5.6M, Gulf War 4.3M)
- Chokepoint effect: The Strait of Hormuz is the throat of global oil trade; its closure affects not only Iran but also Saudi Arabia, Iraq, Kuwait, UAE, and all other Gulf producers
- Insufficient OPEC+ spare capacity: After the EIA redefined effective capacity in December 2025, the market discovered that actual spare capacity was far below previous estimates
- Infrastructure damage: Iranian attacks on Qatari LNG facilities and Saudi export pipelines have caused physical damage that may take months to repair
- Limited pipeline alternatives: Although Saudi Arabia can bypass Hormuz via its east-west pipeline, the maximum capacity is only about 3.6M bpd, far below the volume blocked by the closure
4. Cross-Conflict Comparison
4.1 Core Metric Comparison
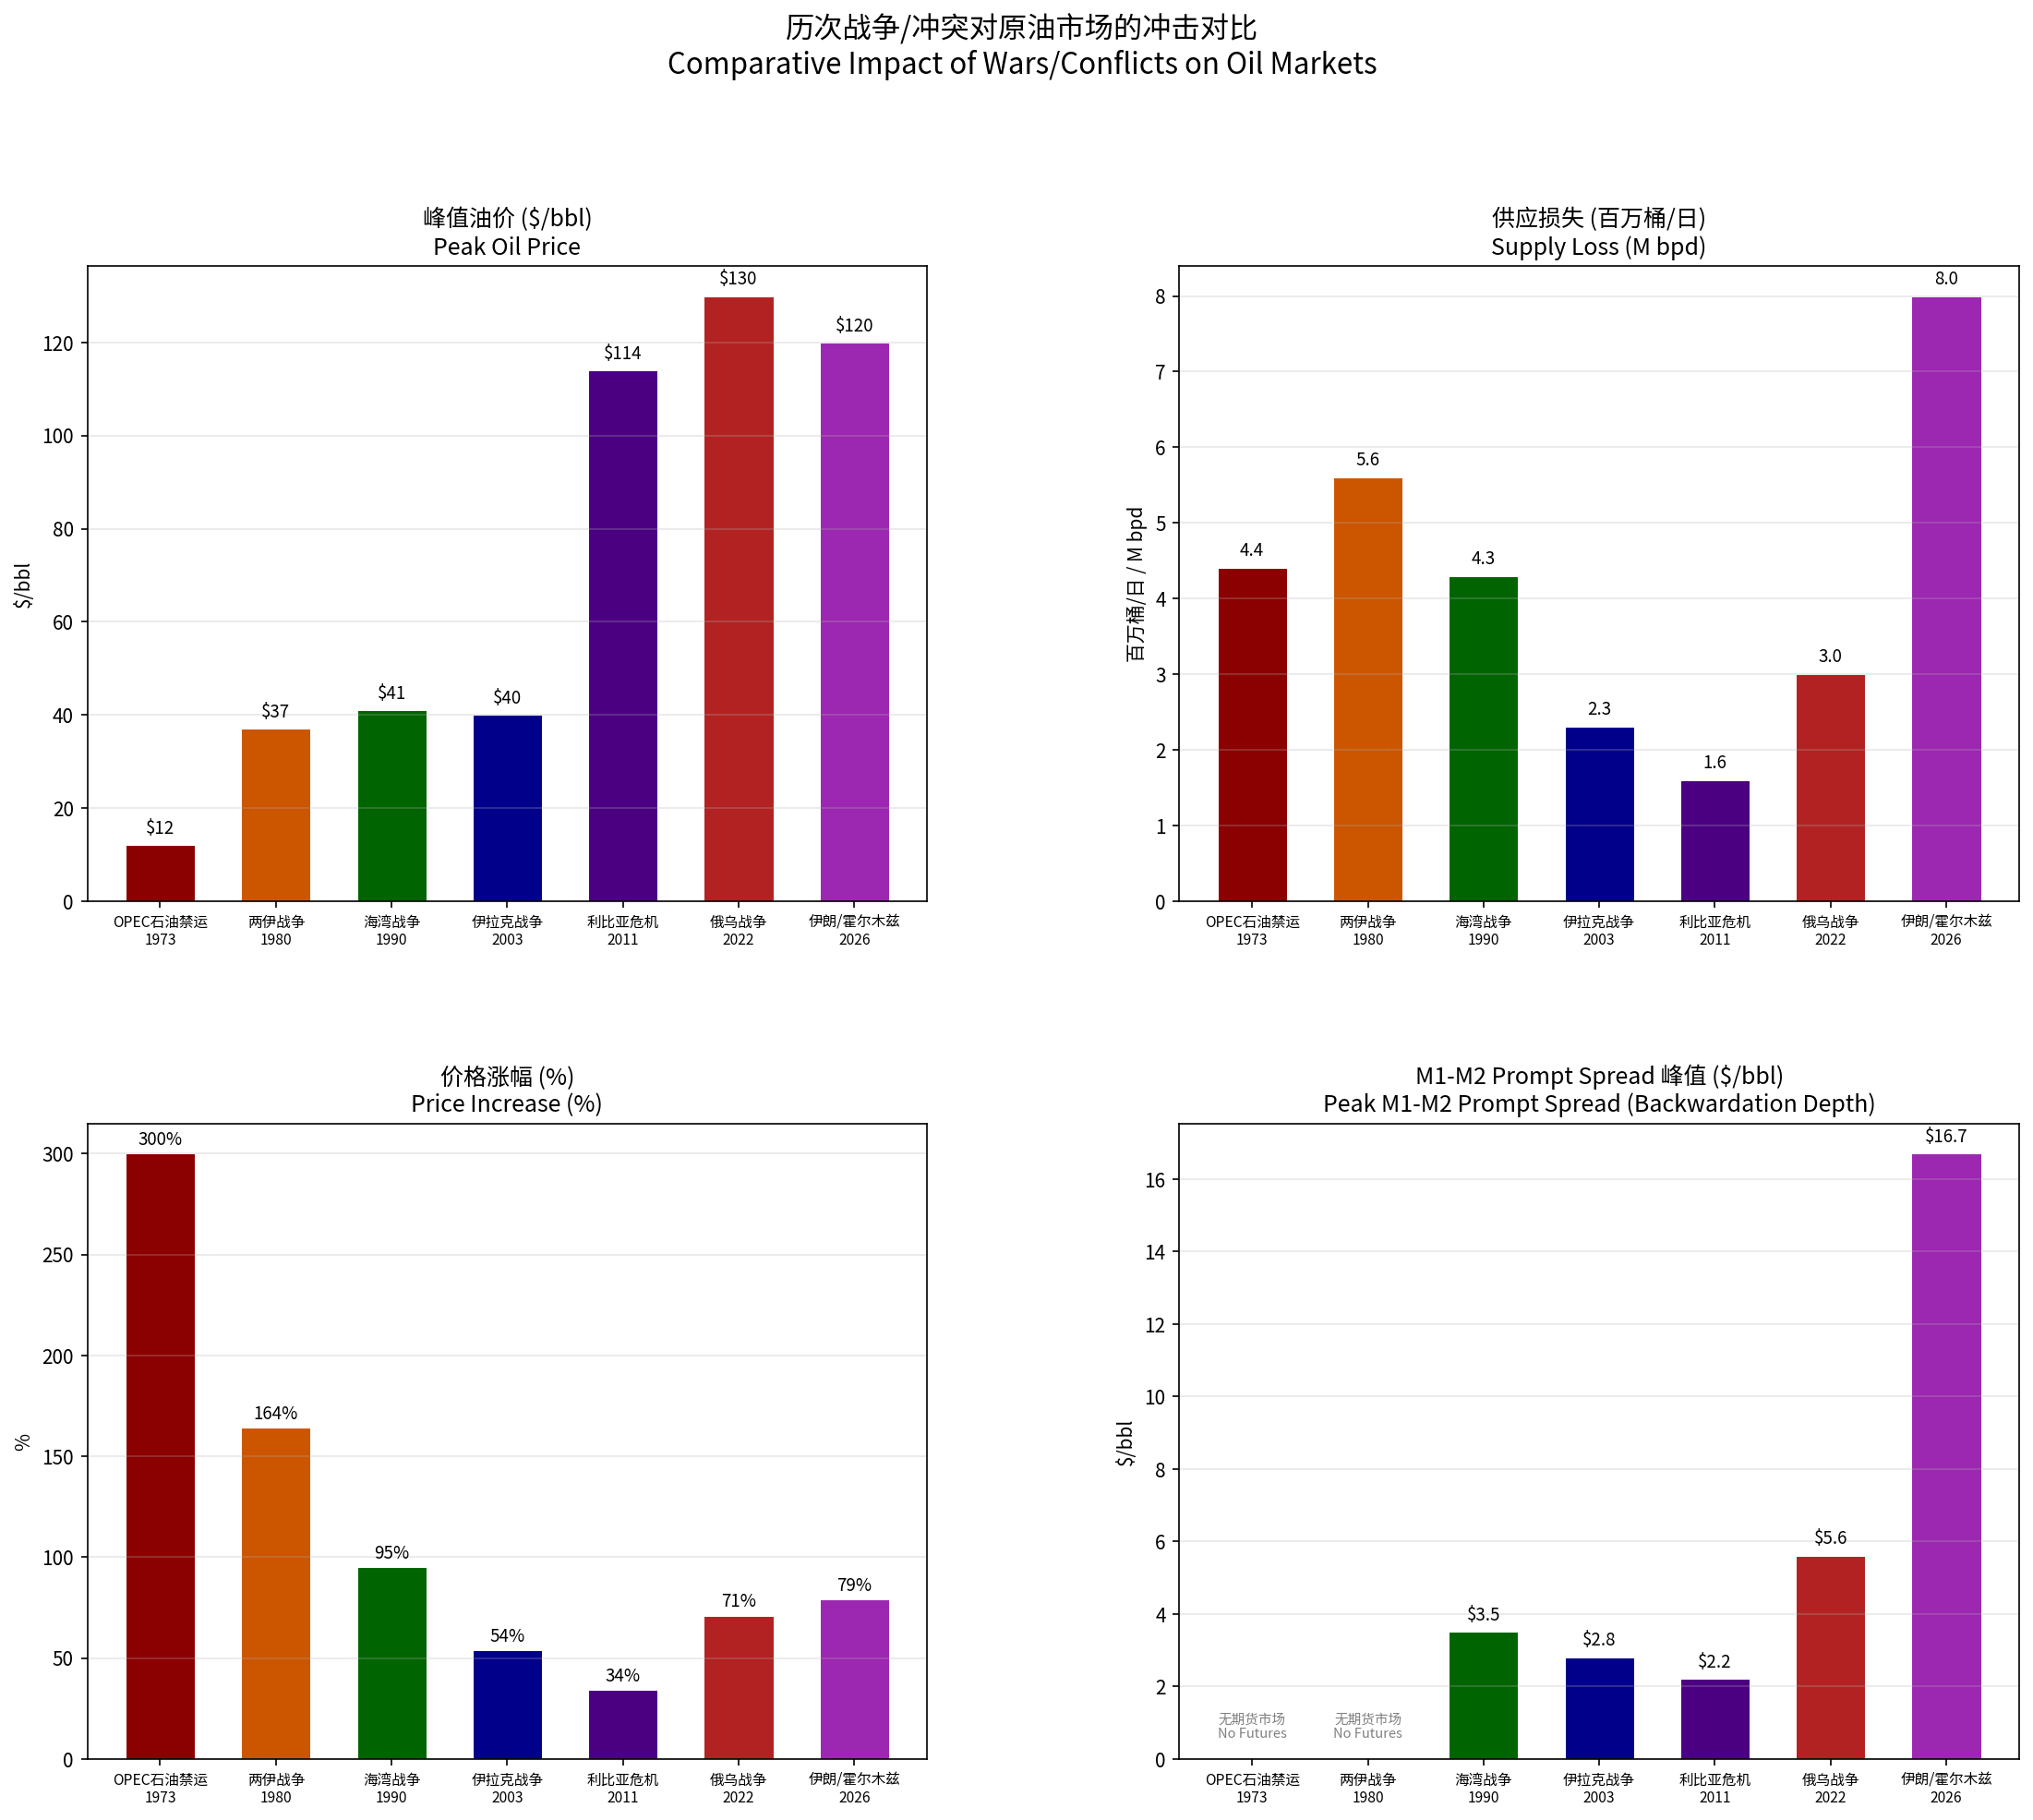
The chart above compares the impact of the seven conflicts on the crude market across four dimensions:
| Conflict | Peak Price | Supply Loss | Increase % | M1-M2 Spread | Severity |
|---|---|---|---|---|---|
| OPEC Embargo 1973 | $12 | 4.4M bpd | 300% | N/A (no futures) | Extreme |
| Iran–Iraq War 1980 | $37 | 5.6M bpd | 164% | N/A (embryonic) | Severe |
| Gulf War 1990 | $41 | 4.3M bpd | 95% | $3.5 | Acute |
| Iraq War 2003 | $40 | 2.3M bpd | 54% | $2.8 | Sustained |
| Libya 2011 | $114 | 1.6M bpd | 34% | $2.2 | Moderate |
| Russia–Ukraine 2022 | $130 | 3.0M bpd | 71% | $5.6 | Super |
| Strait of Hormuz 2026 | $120 | 8.0M bpd | 79% | $16.7 | Record |
4.2 Normalized Price Trajectory Comparison
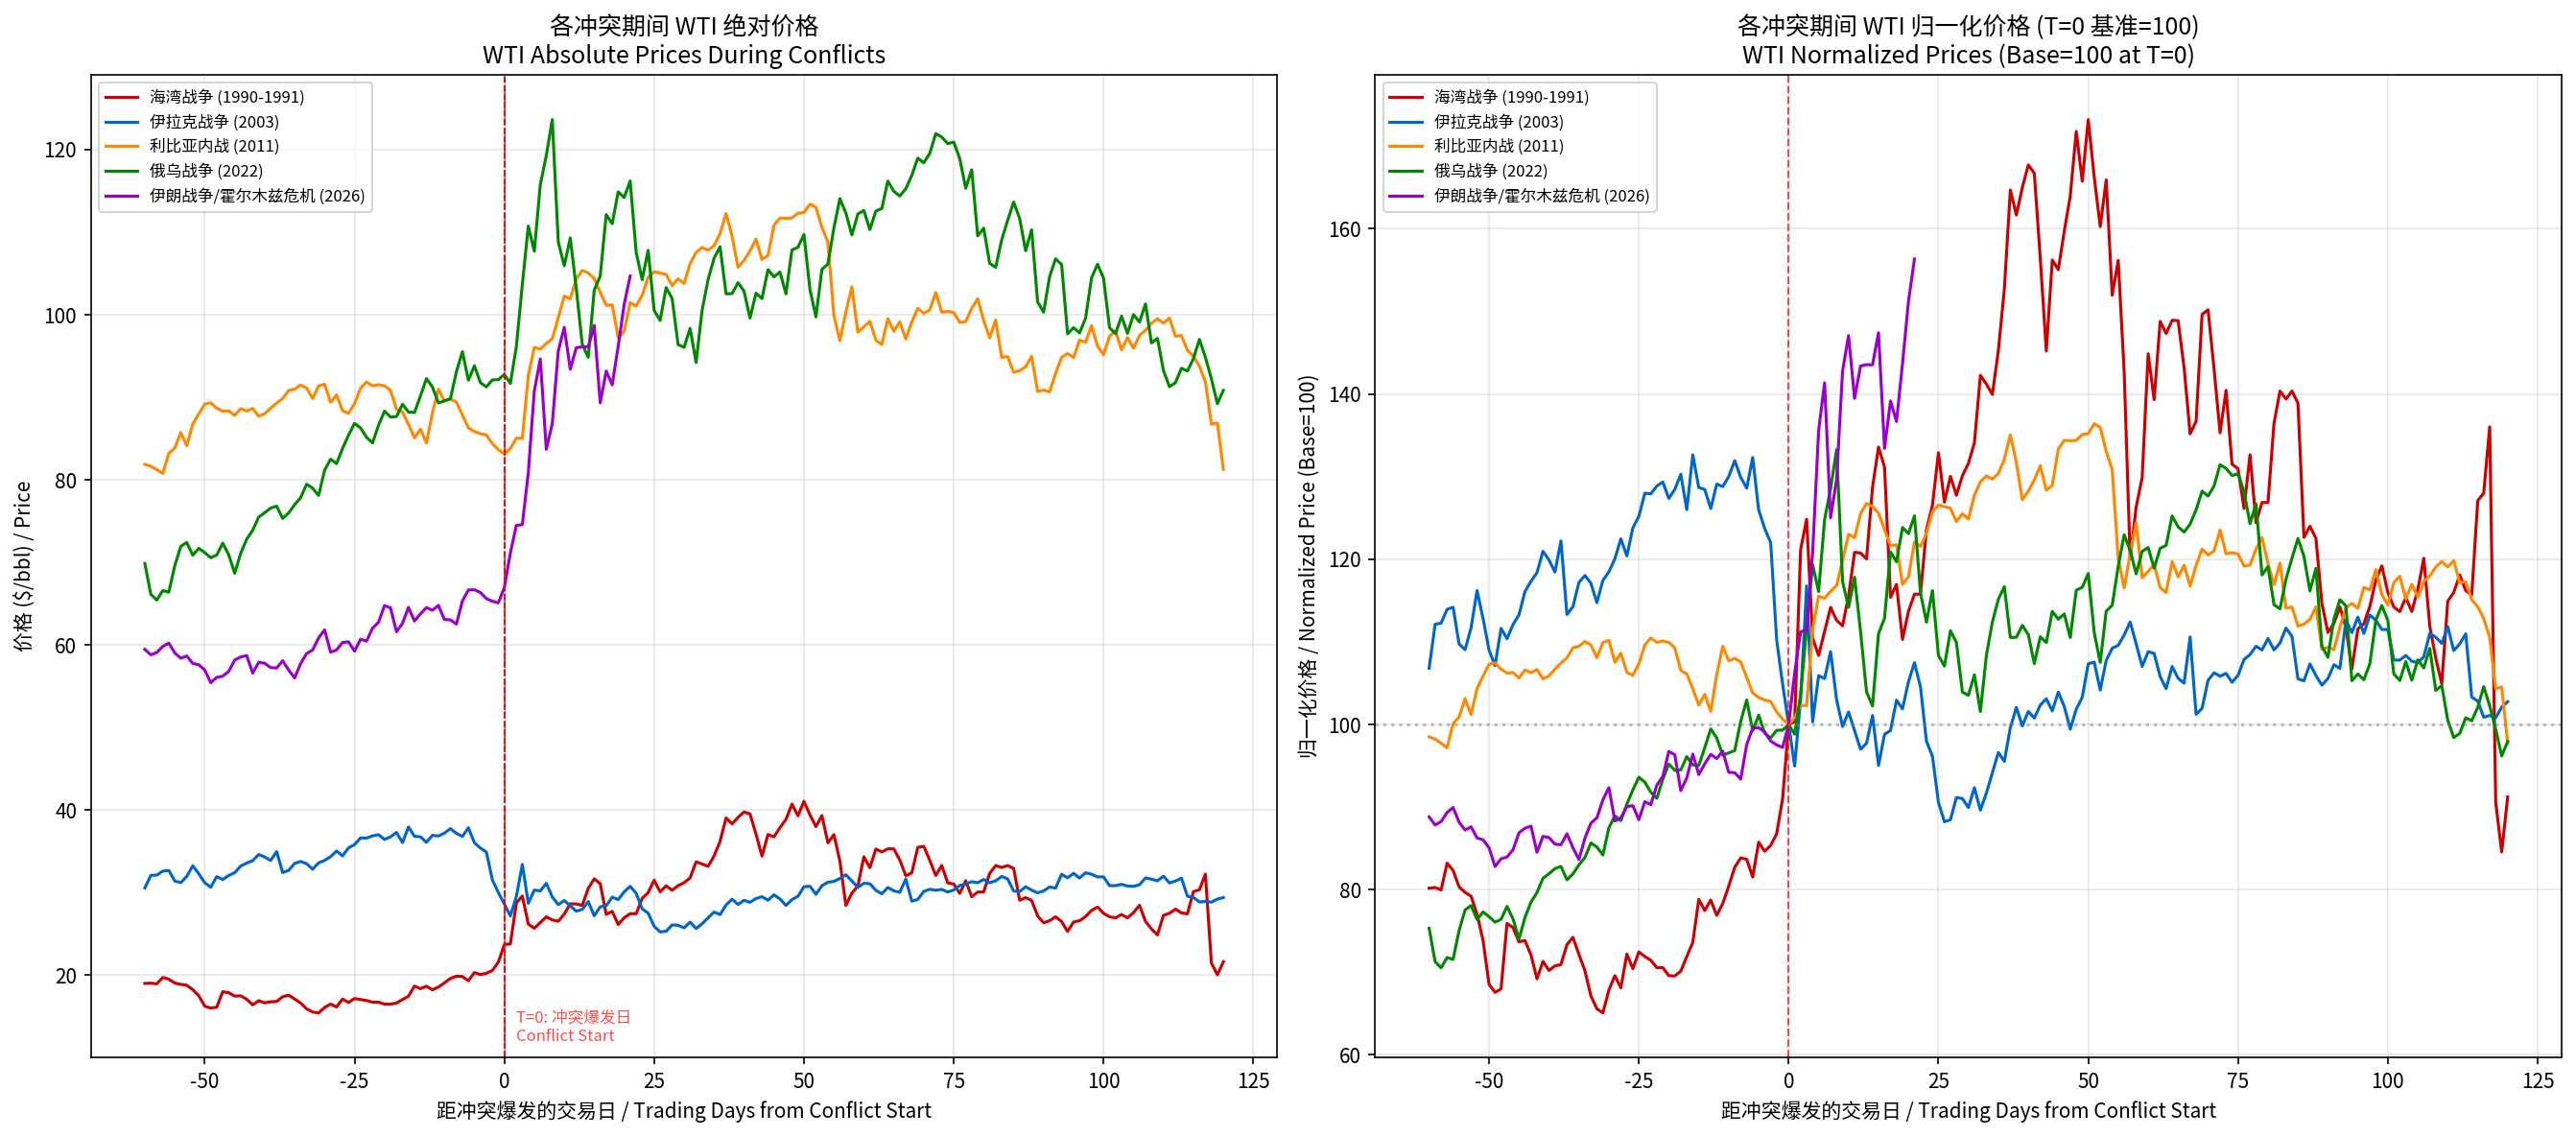
After normalizing the WTI price of each conflict to 100 at the outbreak date (T=0), the following patterns become clear:
- Pre-conflict buildup: Price increases for the Iraq War (2003) began before the outbreak (a 13-month buildup), whereas the Gulf War and Russia–Ukraine War broke out suddenly
- Peak timing: Most conflicts reach their price peak within 20–40 trading days after outbreak
- Reversion path: The Gulf War reverted most quickly (collapse on the day of the air strike), the Russia–Ukraine War most slowly (10 months), while the 2026 Strait of Hormuz crisis is still ongoing
4.3 The Brent–WTI Spread as a Conflict Signal
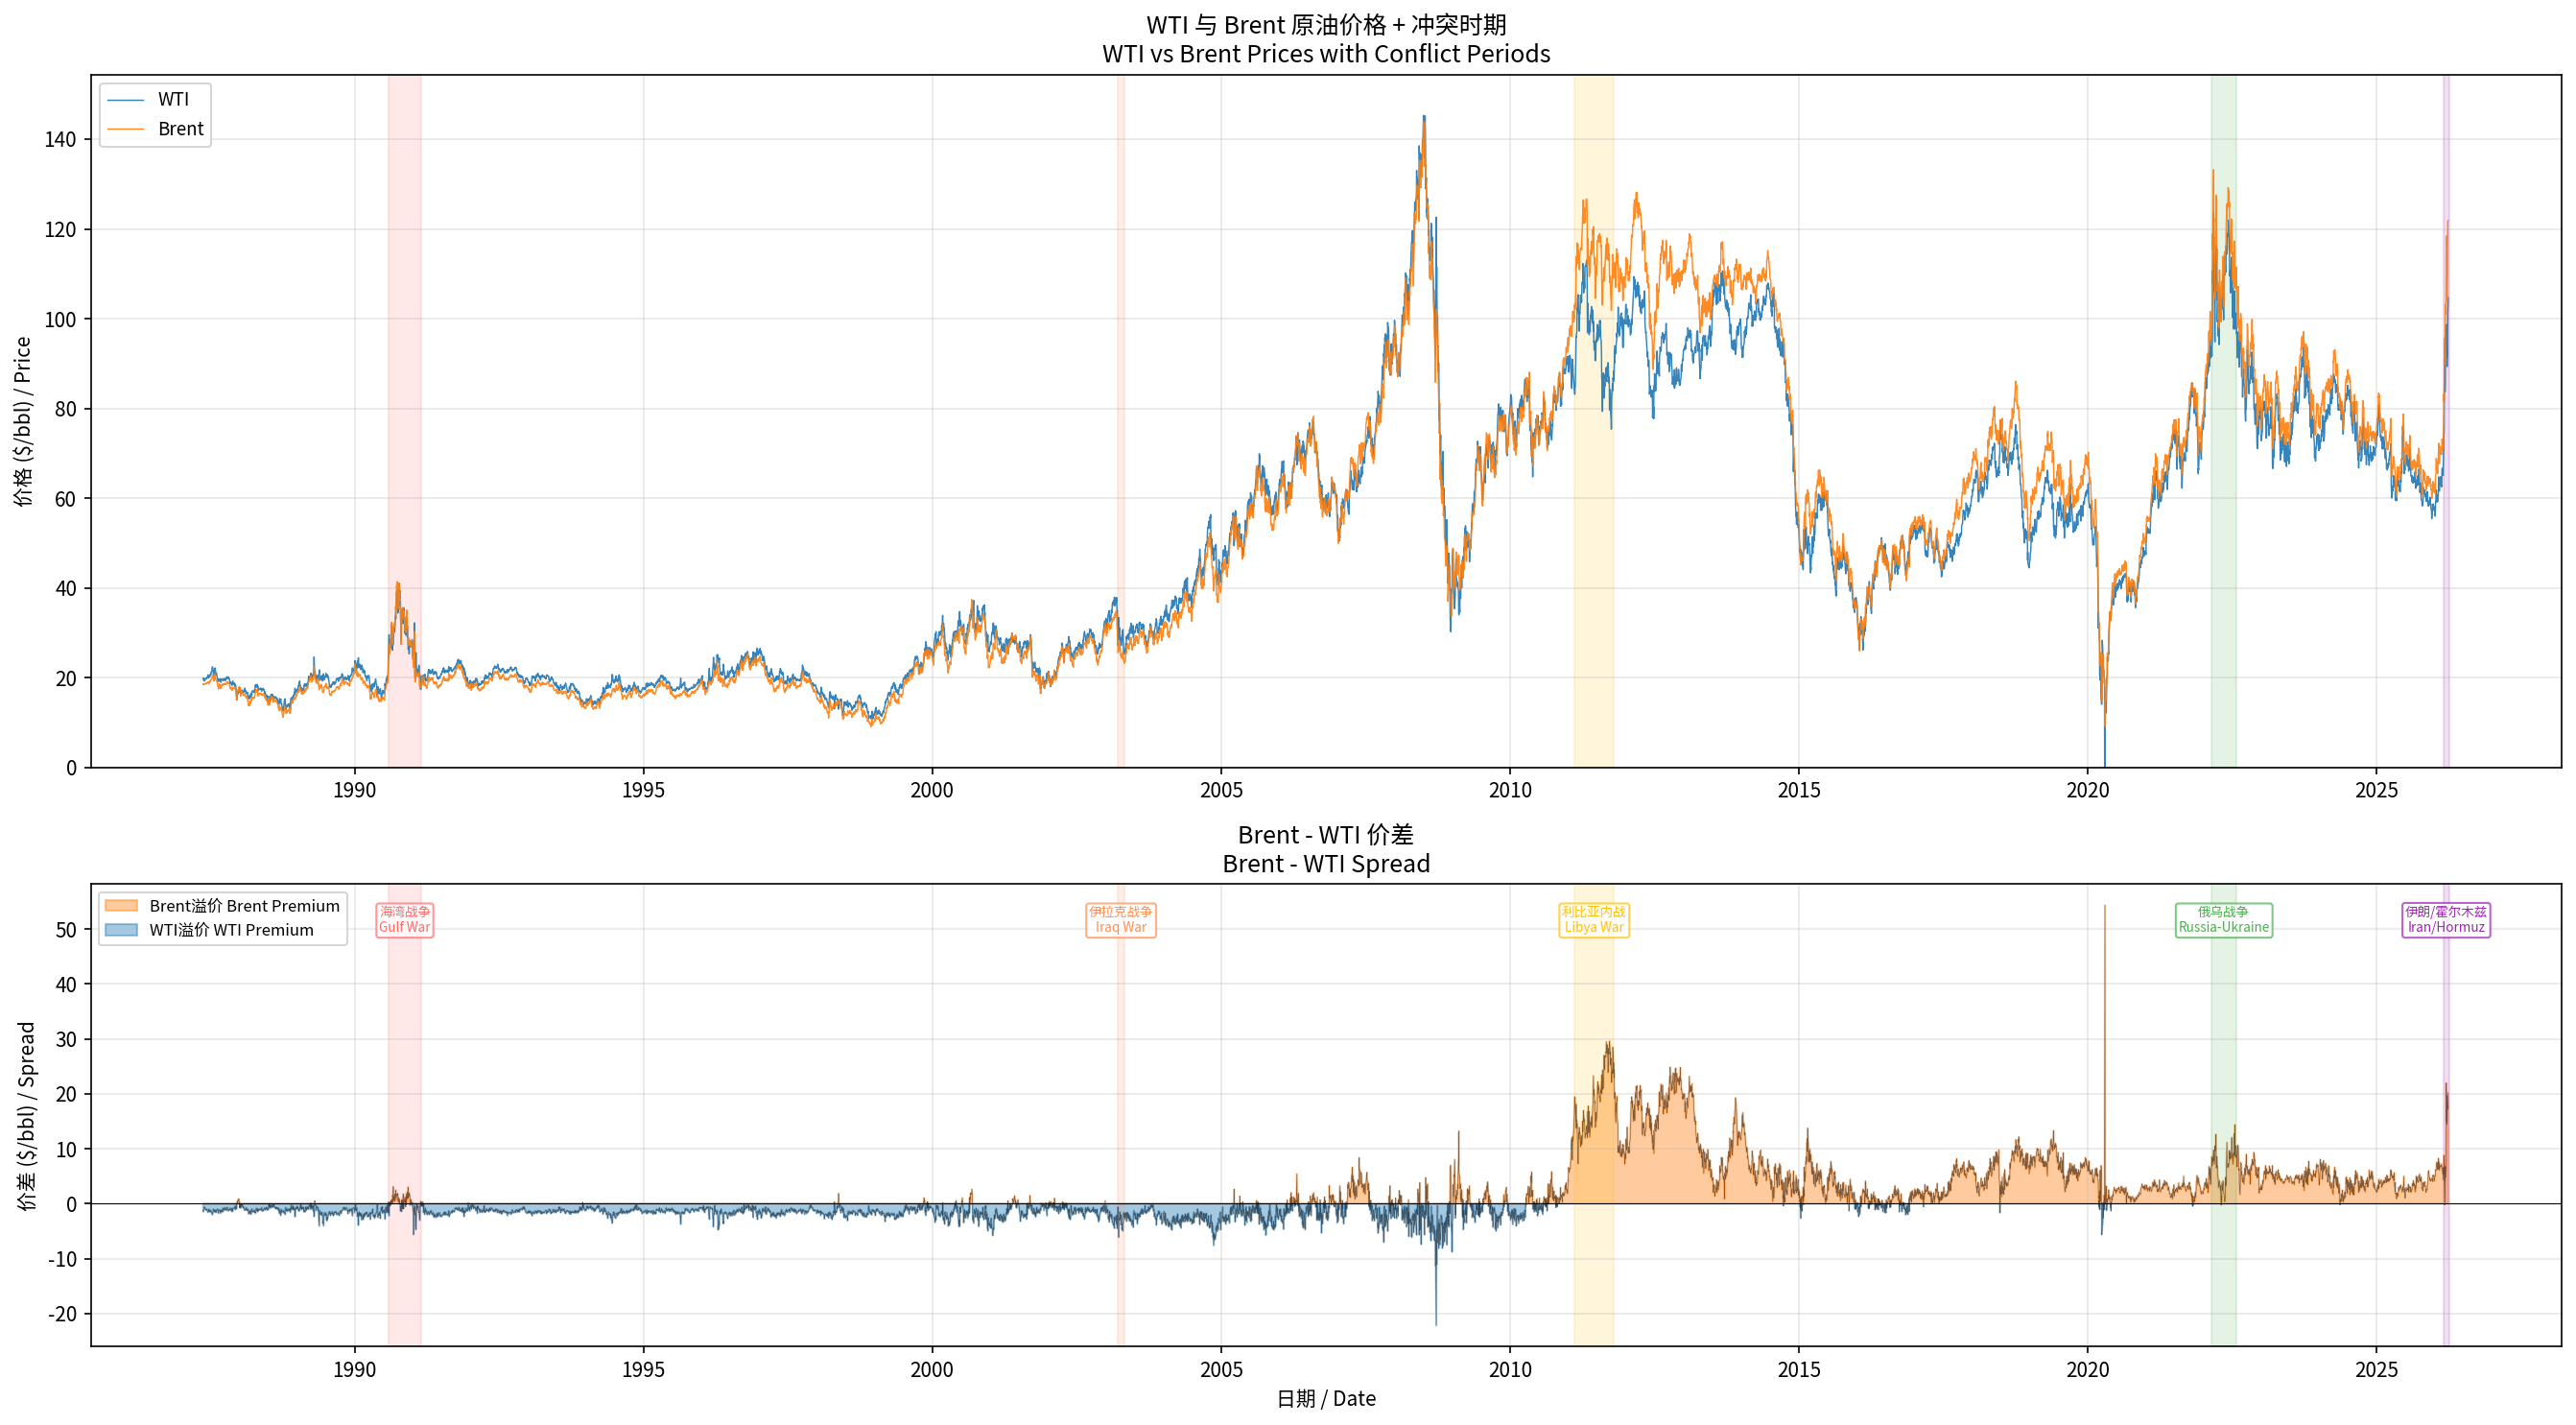
The behavior of the Brent–WTI spread across different conflicts reveals the impact of the geographical location of supply disruption:
- Middle East conflicts (Gulf War, Strait of Hormuz crisis): Brent and WTI rise in tandem, but Brent rises more (Middle Eastern crude has a more direct impact on the Brent pricing complex)
- Libyan crisis: The Brent–WTI spread widened dramatically to over $25/bbl, because Libyan crude was a direct substitute for Brent, while WTI was shielded by rising U.S. shale production
- 2026: The current Brent–WTI spread is about $17/bbl, but WTI has abnormally traded above Brent for a period — reflecting panic buying by U.S. domestic refiners
4.4 Three-Dimensional Relationship: Supply Loss – Price – Backwardation
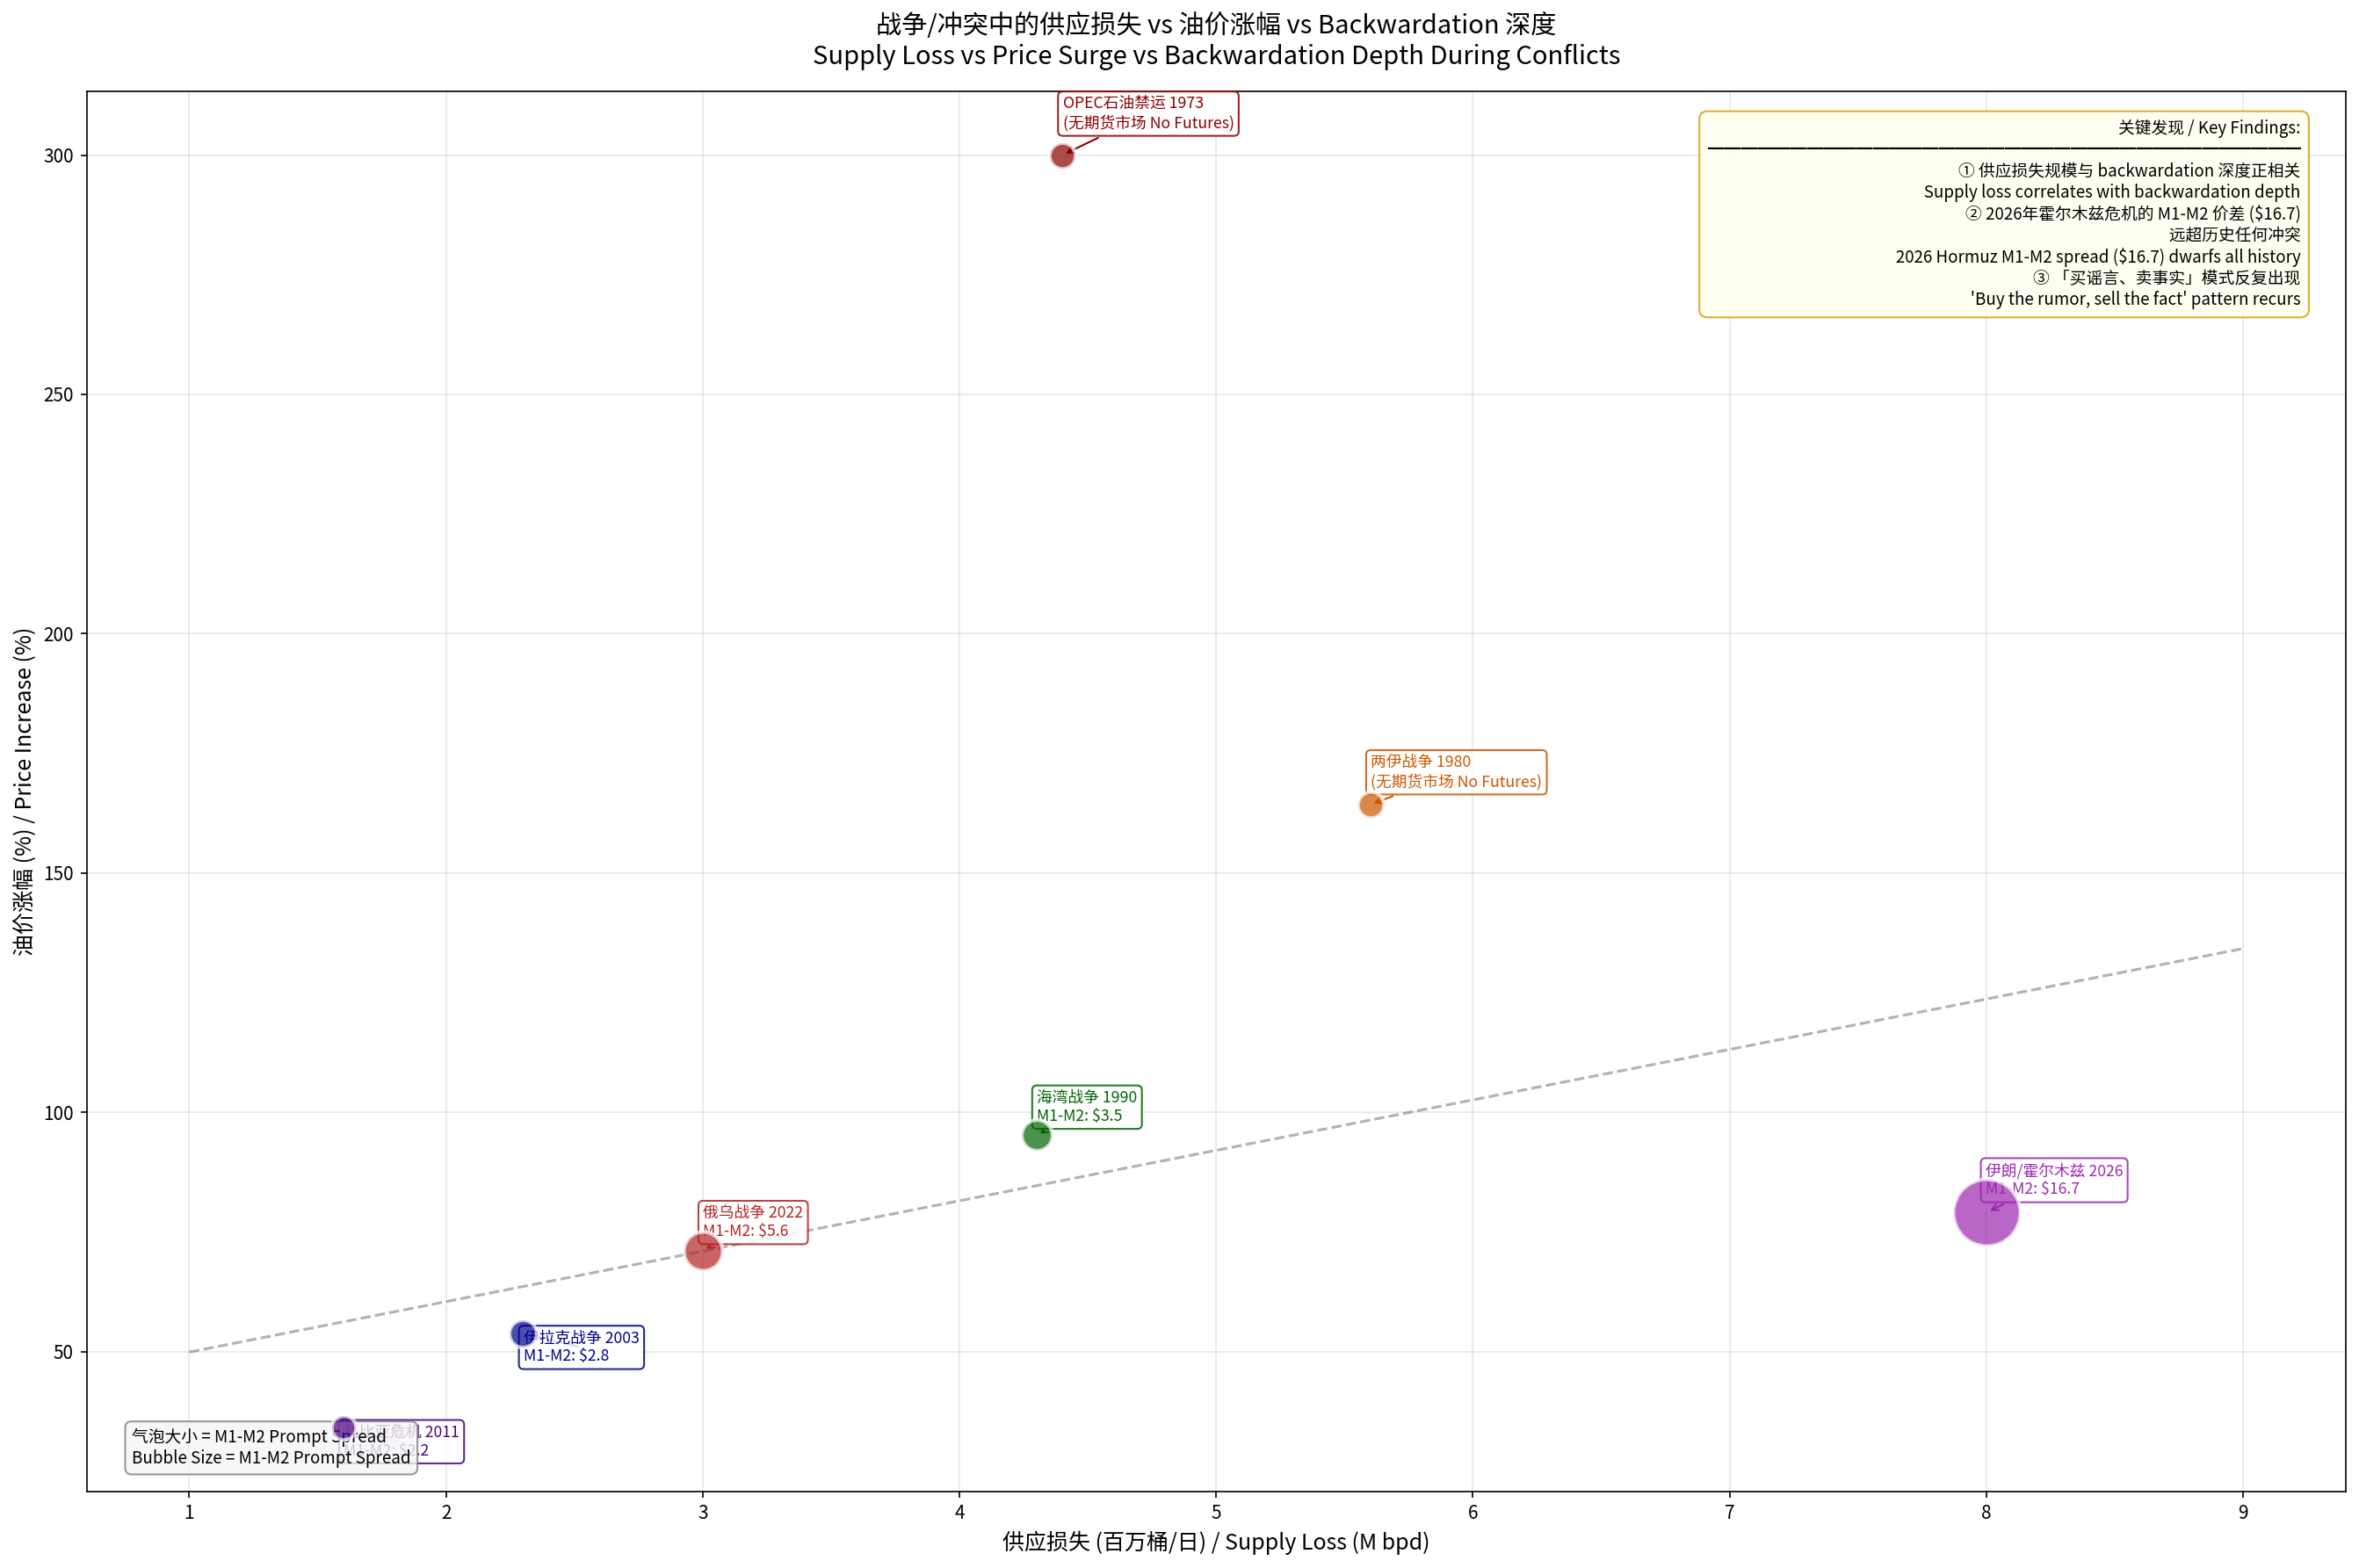
The combined scatter plot reveals the relationship across three key dimensions:
- Supply loss is positively correlated with backwardation depth: The 8M bpd supply loss of the 2026 Strait of Hormuz crisis corresponds to a $16.7 M1-M2 spread, far above the trend line
- Price-increase percentage is biased by base effects: The 300% increase in 1973 reflected an extremely low price base ($3 → $12), while in 2022 and 2026 the absolute increases were larger ($54 and $53), but the percentages were only about 70–80%
- Non-linear growth in bubble size (M1-M2 spread): The severity of backwardation grows non-linearly with the scale of supply loss — an 8M bpd loss produces a backwardation roughly 3 times that of a 3M bpd loss
5. Deeper Patterns and Mechanism Interpretation
5.1 The "Buy the Rumor, Sell the Fact" Pattern
This is one of the most consistent regularities across past conflicts:
| Conflict | Oil Price Peak Date | Military Action Start Date | Price Direction After Action |
|---|---|---|---|
| Gulf War | October 1990 | January 17, 1991 | Single-day plunge of $10.56 |
| Iraq War | February 2003 | March 20, 2003 | Steady decline |
| Libya | April 2011 | March 2011 (NATO intervention) | Fluctuation then decline |
| Russia–Ukraine | March 8, 2022 | February 24, 2022 | Peak 2 weeks later, then decline |
Mechanism Explanation:
- Pre-war uncertainty premium (the probability of worst-case scenarios) pushes prices and backwardation higher
- Once military action begins, uncertainty is replaced by known information; even if actual supply losses continue, prices start retreating
- The market shifts from "fear of the future" to "pricing reality" — the latter is typically lower than the former
5.2 Self-Reinforcement and Self-Limitation of Backwardation
Self-Reinforcement Mechanism (positive feedback):
Self-Limitation Mechanism (negative feedback):
- Extreme backwardation incentivizes producers to accelerate production (current prices far exceed future prices)
- High oil prices lead to demand destruction (economic slowdown, consumption substitution)
- Strategic petroleum reserve releases provide a buffer
- Extremely high prompt spreads attract speculative shorts into deferred contracts
5.3 Determinants of Backwardation Depth
Based on the comparative analysis of the seven conflicts, the core factors driving backwardation depth, ranked by importance:
- Absolute scale of supply loss (most important): 8M bpd > 5.6M bpd > 4.3M bpd → backwardation depth declines accordingly
- Pre-conflict inventory level: Entering a conflict with low inventories (2022) results in more extreme backwardation
- OPEC spare capacity: When spare capacity is insufficient (2022, 2026), the market lacks a safety cushion
- Feasibility of supply substitution: Whether alternative pipeline routes exist (in 2026, Saudi Arabia's east-west pipeline only partially eases the situation)
- Expected duration of the conflict: When markets expect a short conflict → front-end backwardation is extreme but the back end remains relatively flat
5.4 VIX – Oil Price Linkage
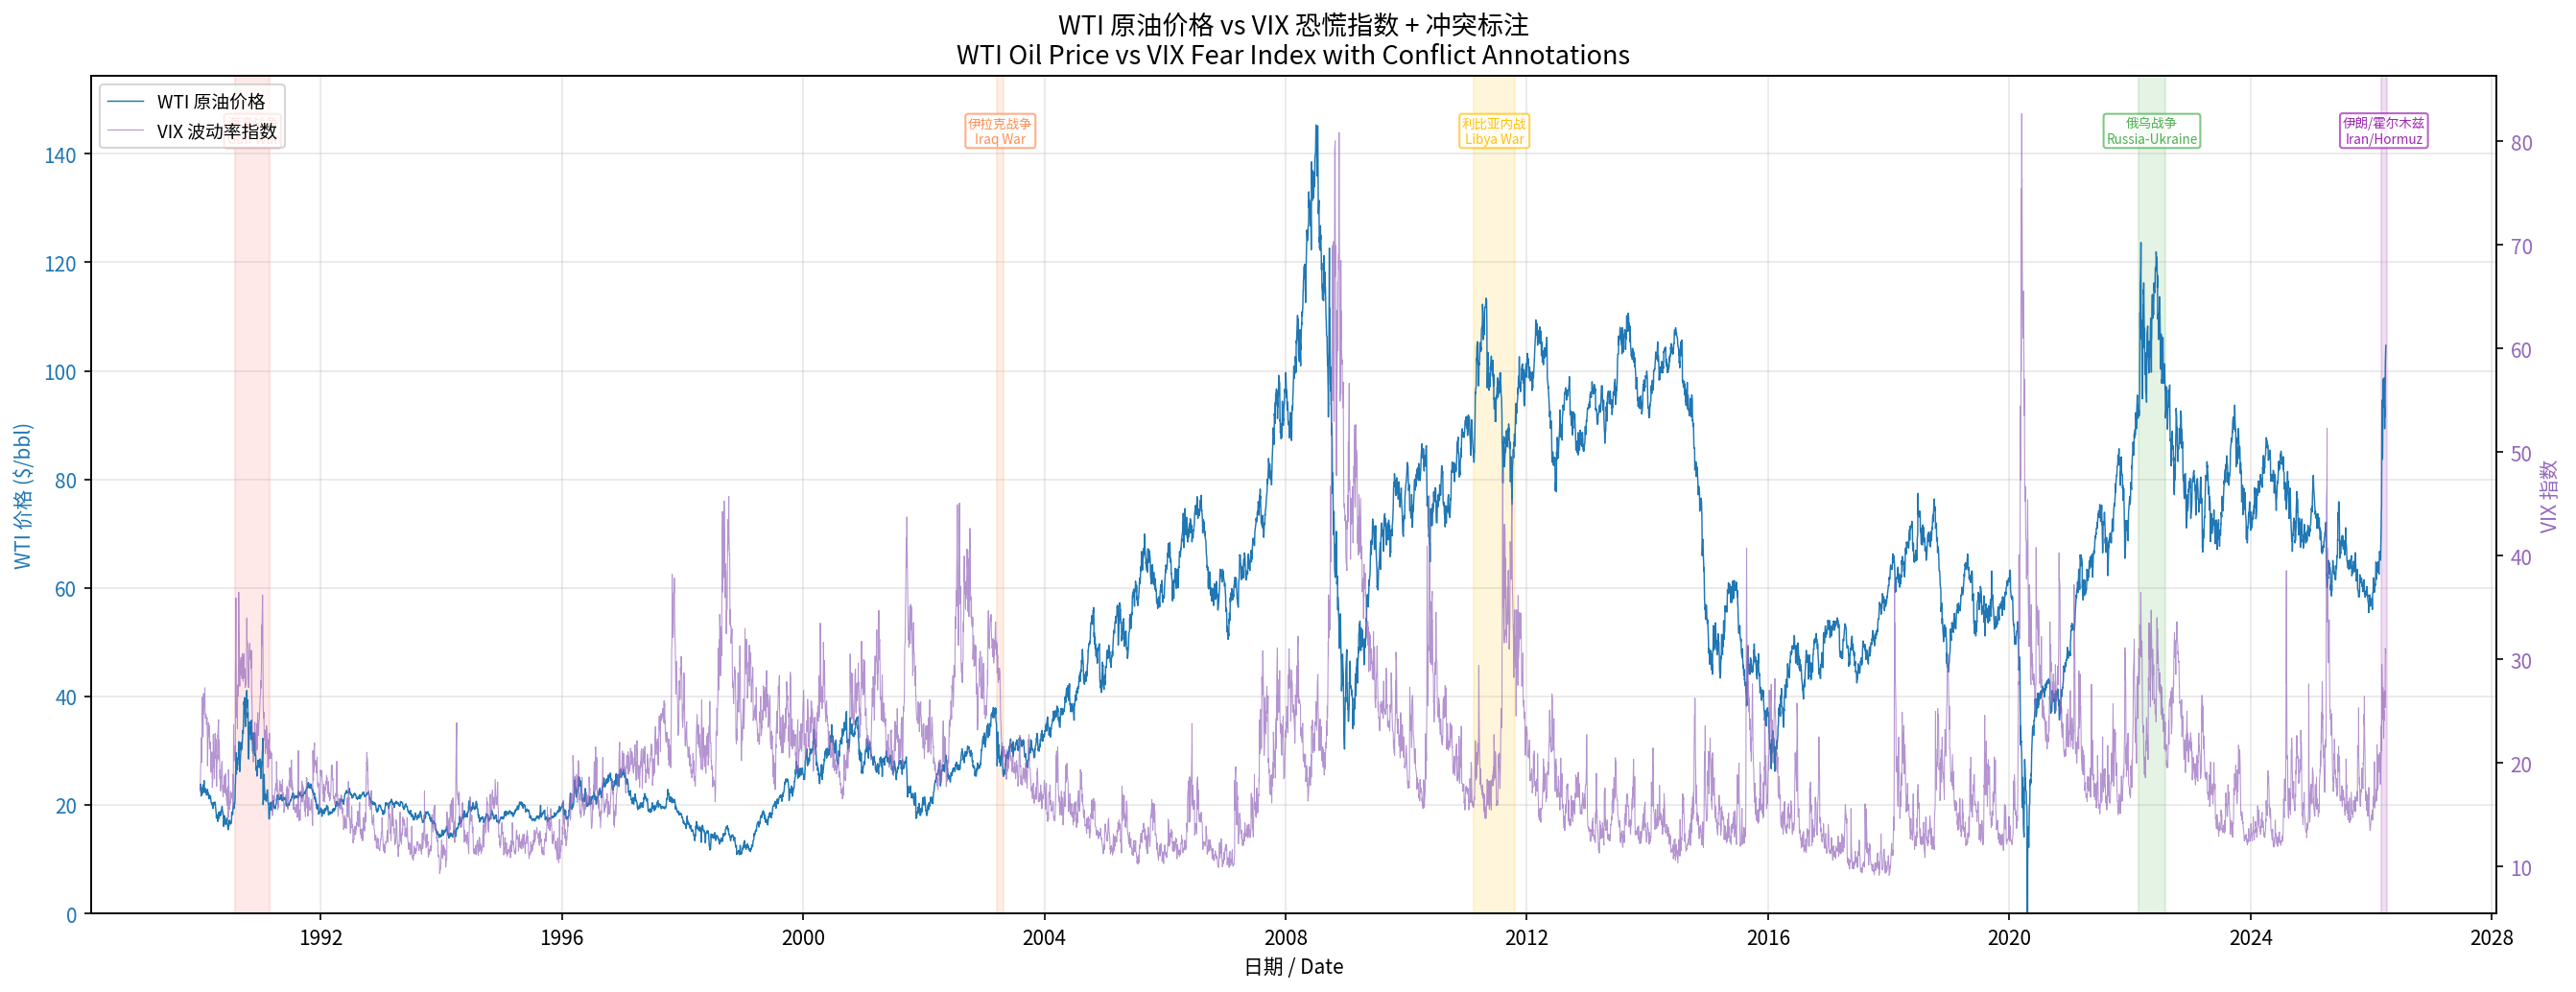
The VIX panic index and oil prices exhibit asymmetric linkage during conflicts:
- Early stage of conflict: VIX and oil spike simultaneously (risk assets broadly under pressure, while crude rises on supply panic)
- Sustained stage of conflict: VIX retreats but oil may remain elevated (financial markets adapt to the new normal, but physical supply tightness persists)
- This means that VIX is a reliable signal for the initial shock of a conflict, but not a good predictor of the depth and persistence of backwardation
6. Implications for the Current Market
6.1 Historical Positioning of the 2026 Strait of Hormuz Crisis
The current Iran / Strait of Hormuz crisis has broken historical extremes along multiple dimensions:
| Indicator | Previous Historical High | 2026 Current | Multiple |
|---|---|---|---|
| Supply loss | 5.6M bpd (Iran–Iraq War) | 8.0M bpd | 1.4x |
| M1-M2 Spread | $5.6 (Russia–Ukraine 2022) | $16.70 | 3.0x |
| 1-month vs 12-month spread | ~$25 (Russia–Ukraine 2022) | ~$40 | 1.6x |
6.2 Scenario Analysis Based on Historical Patterns
Scenario 1: Short-Term Resolution (Strait reopened within 2–4 weeks)
- Reference: Gulf War / Iraq War pattern
- Expectation: Oil prices fall rapidly to $70–80 after military objectives are met, and backwardation narrows sharply within 2–3 weeks
- The prompt spread could fall from $16.70 back to $2–3
- Probability assessment: depends on military progress and diplomatic mediation
Scenario 2: Medium-Term Stalemate (Strait closure persists for 2–3 months)
- Reference: Libya / Russia–Ukraine War pattern
- Expectation: Oil prices stabilize in the $100–120 range, backwardation gradually retreats from extreme levels but remains significant
- IEA strategic reserve releases (400 million barrels) can provide about 50 days of partial buffer
- Global economic growth slows to 1.4% (Oxford Economics forecast), with demand suppressed
Scenario 3: Long-Term Escalation (closure beyond 3 months + severe infrastructure damage)
- Reference: no direct historical analogue (unprecedented scale)
- Expectation: Brent may surge toward $190/bbl (Stratas Advisors); global recession risk rises
- Backwardation could create a new structural pattern — with even the deferred contracts pushed substantially higher
6.3 Investment and Risk Management Implications
- Roll Yield strategies: The current extreme backwardation (annualized over 100%) provides a rare positive roll yield opportunity for long-side rolls, but watch out for sudden curve reversals if the conflict is resolved
- Calendar Spread trades: An M1-M2 spread of $16.70 carries strong mean-reverting gravity — historically, no conflict has sustained such a spread for more than several weeks
- Decoupling of physical and paper oil: The premium for physical delivery currently far exceeds futures quotes, suggesting that futures may be underestimating the actual degree of supply tightness
- "Insurance" value of deferred contracts: The 2030s contracts at around $50/bbl reflect the market's expectation of long-term demand decline (energy transition), but if infrastructure damage is severe, the medium-term contracts (2027–2028) may be significantly underpriced
7. Conclusion
7.1 Core Findings
-
War and conflict are the strongest catalysts of crude oil backwardation. All seven major conflicts, without exception, pushed WTI into backwardation or deepened an existing backwardation, and the depth of backwardation is highly positively correlated with the scale of supply loss.
-
The three-phase model of backwardation is highly consistent: shock (sharp flip in term structure) → sustain (persistent supply panic) → resolve (rapid reversion after conflict resolution). The Gulf War and Iraq War demonstrate this pattern most perfectly.
-
"Buy the Rumor, Sell the Fact" is the most reliable price-behavior pattern. In every historical conflict, prices and backwardation began to retreat after military action formally began or certainty increased — the premium for uncertainty itself is often greater than the premium for actual loss.
-
The 2026 Strait of Hormuz crisis is a new extreme in futures market history. An M1-M2 spread of $16.70 is 3 times the 2022 record, reflecting the unique strategic role of the Strait of Hormuz as the throat of global oil trade — blocking it severs the export channels of multiple Gulf powers simultaneously, not just one producer.
-
Convenience yield is the theoretical key to understanding backwardation. When physical crude becomes scarce, the value of holding it (avoiding shutdowns, fulfilling contractual obligations) far exceeds storage costs, pushing the term structure into backwardation. This mechanism is revalidated in every conflict.
7.2 Historical Rhyme
The history of oil prices does not simply repeat itself, but it rhymes. Every war follows a similar script — supply panic, physical scrambling, deepening backwardation — and then at some point the market realizes that the worst-case scenario has not materialized (or has already been priced in), and the curve begins to revert.
The only thing that differs is the scale of each shock and the structural fragility of the market. What is different in 2026 is this: it is the first time the world's most critical oil-shipping chokepoint has been entirely blocked, and the market was already in a low-inventory, low-spare-capacity state of fragility before the shock arrived.
8. References
Government and Institutional Reports
- U.S. EIA, "Crude oil prices rise above $100 per barrel after Russia's further invasion into Ukraine," Dec 2022
- U.S. EIA, "Libyan supply disruption may have both direct and indirect effects," Mar 2011
- IEA, "Oil Market Report - March 2026," Mar 2026
- U.S. GAO, "Oil Futures Market Behavior During the Gulf War," 1991
- Federal Reserve Bank of Dallas, "The Rise and Fall of Oil Prices," 1991
- Federal Reserve Bank of St. Louis, "Does Uncertainty about Oil Prices Slow Down the Economy?" Oct 2003
- Federal Reserve Bank of Dallas, "What the closure of the Strait of Hormuz means for the global economy," Mar 2026
Academic Research
- Lorusso & Ferrara, "Oil Prices and the Iraq War: Market Interpretations of Military Developments," Columbia University / Naval Postgraduate School, 2003
- Fattouh, B., "Reinforcing Feedbacks, Time Spreads and Oil Prices," Oxford Institute for Energy Studies, Mar 2009
- ScienceDirect, "Temporal dynamics of geopolitical risk: An empirical study on crude oil futures," 2024
- ResearchGate, "The impact of Russia–Ukraine war on crude oil prices: an EMC framework," 2024
- Cornell eCommons, "Insights from convenience yields and implied storage costs"
Market Analysis and News
- Reuters, "Near-term oil prices hit record premium over later deliveries," Apr 2, 2026
- Reuters, "Iran war shock drives steepest hike yet in oil price forecasts," Mar 31, 2026
- Bloomberg, "The Strait of Hormuz Oil Shock Is Now Heading West," Mar 29, 2026
- CNBC, "The oil market is in 'backwardation' — Here's what that means," Mar 26, 2026
- CME Group, "WTI Insights by PVM," Feb 2026
- Cornerstone Research, "From Zero to 100: Crude Oil Price Changes in 2020–2022"
- Oxford Economics, "Prolonged war in Iran could tip the global economy into recession," Mar 2026
- AEGIS Hedging, "WTI Curve Close To Steepest Backwardation In Past 15 Years," Mar 2021
Data Sources
- FRED: DCOILWTICO (WTI daily), WTISPLC (WTI monthly), DCOILBRENTEU (Brent daily), VIXCLS (VIX)
- CME Group: WTI Crude Oil Futures (CL) term-structure data